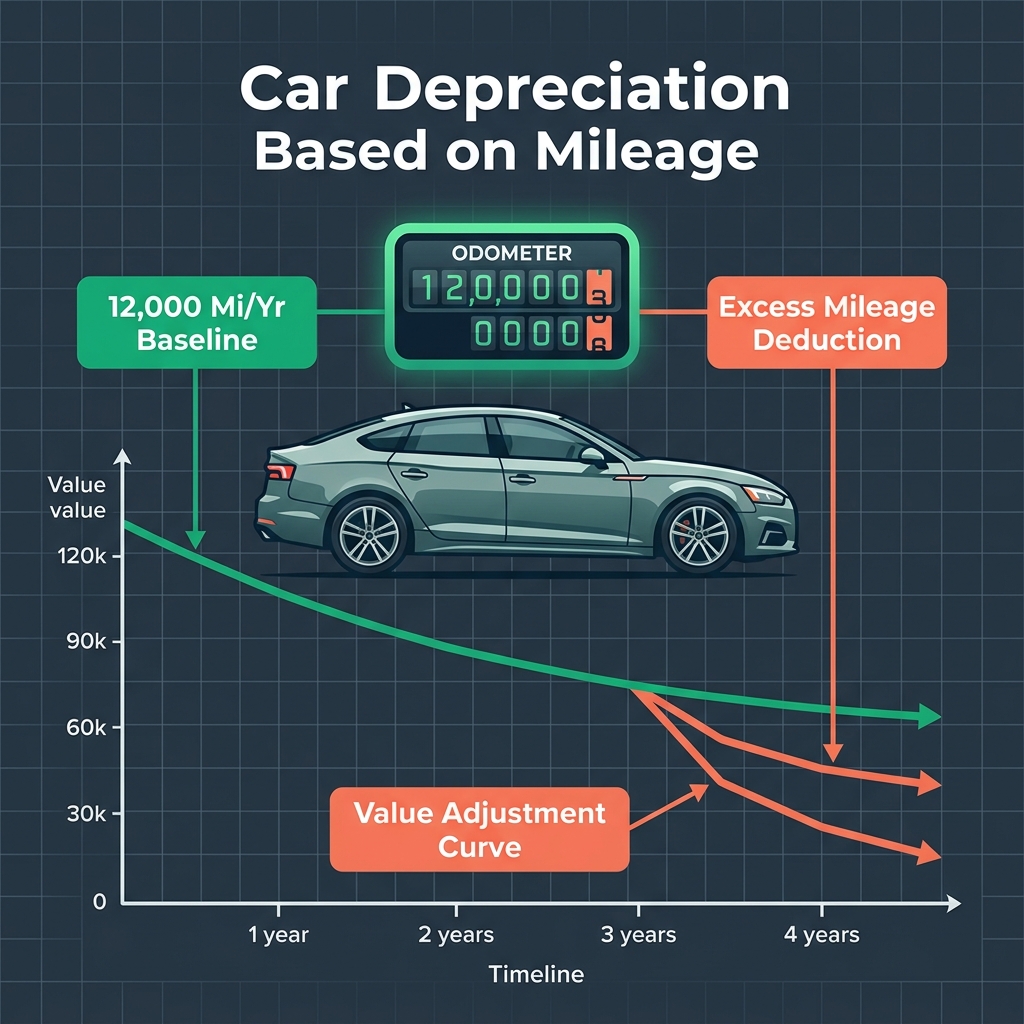
Car depreciation based on mileage is calculated by comparing an odometer reading against an age-adjusted benchmark of 12,000 miles per year and applying a per-mile deduction to the vehicle’s market value. Valuation formulas apply a baseline charge—commonly 0.25% per 1,000 excess miles or roughly $0.10 to $0.15 per mile—reducing trade-in and resale value by approximately $500 to $1,500 for every 10,000 miles driven above average.
Standard valuation algorithms evaluate a vehicle’s worth through a two-stage process. First, age-based compound depreciation establishes a baseline value from the original MSRP. Mainstream passenger cars typically experience an 18% annual compound depreciation rate during their initial years. Once that base value is set, the formula calculates expected usage by multiplying the vehicle’s age in years by the 12,000-mile annual average baseline.
Any distance recorded on the odometer beyond that baseline is classified as excess mileage. For instance, a four-year-old vehicle with 68,000 miles has accumulated 20,000 excess miles beyond its 48,000-mile expected benchmark. That 20,000-mile surplus triggers an additional value reduction on top of standard age depreciation. Drivers navigating daily trips in Boardman Township frequently accumulate higher mileage than national averages, directly impacting final appraisal calculations.
Understanding how odometer readings influence vehicle value helps sellers protect their equity. If you are preparing to upgrade your vehicle, you can stop by our Boardman showroom or give our team a quick call to learn how current market demand influences your appraisal.
Table of Contents
- How Does a Mileage-Based Valuation Formula Translate Excess Miles into Percentage Depreciation?
- What Percentage of Resale Value Does a Vehicle Lose Per 10,000 Excess Miles?
- How Many Dollars of Value Do Used Cars and Trucks Lose Per 10,000 Miles Above Average?
- Common Questions About Vehicle Mileage and Trade-In Valuation
How Does a Mileage-Based Valuation Formula Translate Excess Miles into Percentage Depreciation?
A modern mileage-based valuation formula translates excess miles into percentage depreciation by compounding a fractional value loss—typically 0.25% per 1,000 miles—against the vehicle’s age-adjusted baseline value. For every 10,000 miles driven above the standard 12,000-mile annual threshold, this calculation yields an approximate 2.5% decrease in overall market value.
To understand how this functions in real-world pricing models, consider the foundational mathematics used by professional valuation databases. The mathematical model applies age depreciation and excess mileage adjustments sequentially:
- Step 1: Calculate Expected Mileage Baseline — Multiply vehicle age in years by 12,000 miles.
- Step 2: Determine Excess Mileage Surplus — Subtract expected miles from actual odometer miles (if actual mileage is lower, excess equals zero).
- Step 3: Calculate Mileage Factor — Apply the formula
0.9975 ^ (Excess Miles / 1,000)to determine the remaining value percentage after mileage deductions. - Step 4: Compute Base Depreciated Value — Multiply the age-depreciated figure by the excess mileage factor.
Because excess mileage depreciation is applied as a percentage multiplier rather than a static dollar fee, higher-value vehicles experience larger absolute dollar adjustments. A nearly new vehicle with a high baseline value loses more dollar equity per 10,000 excess miles than an older vehicle, even though the mathematical percentage rate remains consistent across both scenarios.
Secondary market factors also interact with the primary mileage formula. Overall physical condition, accident history, ownership count, and documented service records act as secondary decimal multipliers. A vehicle with 10,000 excess miles but a spotless maintenance history can recapture a portion of that percentage loss because full service records contribute roughly a 4% value premium in valuation models.
What Percentage of Resale Value Does a Vehicle Lose Per 10,000 Excess Miles?
Across most mainstream vehicle categories, a car loses between 1% and 3% of its total resale value for every 10,000 miles driven above the age-adjusted national average. Premium body styles and sports cars can experience higher percentage losses reaching 5% to 10% per 10,000 excess miles, whereas commercial trucks and utility vehicles show greater percentage resilience.
Percentage depreciation varies substantially depending on the vehicle’s age bracket and current odometer total. Mileage loss does not follow a completely flat line across a vehicle’s life cycle. Instead, depreciation occurs in distinct valuation bands:
- Under 30,000 Miles — Initial mileage accumulation carries a smaller percentage penalty because the vehicle remains within factory coverage windows and displays minimal mechanical wear.
- 30,000 to 60,000 Miles — The core sweet spot for used vehicle buyers. Depreciation rate per mile stabilizes, making excess mileage penalties predictable at roughly 1% to 2% per 10,000 miles.
- 60,000 to 90,000 Miles — Depreciation accelerates as major scheduled maintenance intervals approach and components enter expected replacement cycles.
- Crossing 100,000 Miles — Passing six figures on the odometer creates a steep psychological barrier for retail shoppers, causing percentage value drops of 3% or more per 10,000 excess miles.
Vehicle category plays a significant role in percentage sensitivity. Luxury sedans suffer steeper percentage penalties per 10,000 miles because pre-owned buyers anticipate higher out-of-warranty repair costs. Conversely, durable crossovers and trucks retain percentage value more effectively over long distances. To see where your current vehicle sits on this curve, you can value your trade-in online using transparent market data.
How Many Dollars of Value Do Used Cars and Trucks Lose Per 10,000 Miles Above Average?
A typical used compact car or midsize crossover loses between $500 and $900 in market value for every 10,000 miles accumulated above average usage. Full-size pickup trucks and premium body-on-frame SUVs lose significantly more in absolute terms, dropping $1,300 or more per 10,000 excess miles due to their higher initial purchase prices and higher market baselines.
Recent automotive market research tracking 10,000-mile increments across popular model lines illustrates how dollar depreciation scales across different vehicle types:
| Vehicle Model & Category | Estimated Value Loss per 10,000 Excess Miles | Market Characteristics |
|---|---|---|
| :– | :– | :– |
| Full-Size Pickup Truck | $1,300 – $1,400 | High initial MSRP maintains large dollar drops despite strong percentage retention. |
| Midsize Sedan | $700 – $900 | Steady dollar decline aligned closely with average commuting wear. |
| Compact Crossover | $600 – $700 | Strong pre-owned demand softens dollar depreciation per mile band. |
| Compact Sedan | $500 – $600 | Lower starting baseline results in smaller dollar adjustments per 10,000 miles. |
When drivers evaluate trade-in options, the question we hear most often is how much real cash value an extra 10,000 miles costs on a used sedan compared to a heavy-duty truck. On a mainstream sedan, an extra 10,000 miles reduces trade-in offers by roughly $600, whereas an extra 20,000 miles can reduce value by more than $1,200.
Regional demand patterns also influence these dollar adjustments. For commuters driving daily between healthcare and education centers in Youngstown, fuel-efficient crossovers with average mileage retain premium market positioning.
Common Questions About Vehicle Mileage and Trade-In Valuation
Q: Does driving fewer than 12,000 miles per year increase my car’s value?
A: Driving below the 12,000-mile annual threshold prevents excess mileage penalties and preserves higher market value compared to average-mileage vehicles. Low-mileage cars benefit automatically in appraisal formulas by avoiding the standard per-mile deduction, allowing well-maintained vehicles to command premium trade-in offers.
Q: Is there a specific odometer milestone where car value drops most dramatically?
A: Vehicle depreciation accelerates significantly as an odometer approaches 100,000 miles due to psychological buyer thresholds and expiring powertrain coverage. While early depreciation drops fastest in years one through three, passing six-figure mileage triggers a sharp market value adjustment across all vehicle categories.
Q: Can complete service records offset high mileage penalties during trade-in?
A: Documented maintenance records increase buyer confidence and can boost vehicle market value by approximately 4%, mitigating part of a high-mileage penalty. Proving regular oil changes and scheduled service demonstrates proper care, reassuring appraisers that mechanical components remain reliable despite higher odometer readings.
Q: How do excess lease miles compare to trade-in mileage deductions?
A: Excess lease fees generally range from $0.15 to $0.30 per mile, which closely mirrors the $0.10 to $0.15 per-mile market depreciation applied during standard trade-in appraisals. Both systems penalize excess wear, making mileage management equally critical whether returning a lease or trading in a purchased vehicle.
Q: What is the best mileage range to sell or trade in a vehicle for maximum value retention?
A: Trading in a vehicle between 30,000 and 60,000 miles strikes an ideal balance, capturing strong resale value after steep initial depreciation while avoiding major 100,000-mile odometer cliffs. Initiating an appraisal before crossing major maintenance intervals ensures maximum equity retention for your next vehicle purchase.
When you are ready to explore your options, our team provides prompt, transparent vehicle appraisals on any make or model. You can visit our showroom location on Market Street, give our team a direct call, or explore our online resources to view frequently asked questions and get a current appraisal information today.
© 2026 Ken Ganley Buying Center Boardman. All rights reserved.
While every effort has been made to ensure the accuracy of the information displayed on this website, the vehicle values, offers, and listings shown may not reflect all accurate vehicle details or current market conditions. Vehicle photos may be representative only and may not match the actual vehicle. All offers, appraisals, and transactions are subject to vehicle inspection, verification, and prior sale. Final purchase amounts may vary based on condition, equipment, history, and market factors. Please contact the Dealership for complete details and confirmation.